
FOR ORGANISATIONS THAT WANT TO STEER DIFFERENTLY
Do you want to
steer differently
with data?
From financial reports and dashboards to management information that shows what is really happening and what is coming.

STEER DIFFERENTLY × THE RIGHT NUMBERS × THE RIGHT STORIES × OWNERSHIP
Steer differently
Sound familiar? You have plenty of data. But does it help you make better decisions?
01. WE HAVE LOTS OF FIGURES.
But which numbers really matter?
02. WE HAVE DASHBOARDS.
But we mostly look at what has already happened.
03. EVERY TEAM REPORTS KPIs.
But do they also feel responsible for them?
04. WE WANT TO BE MORE DATA-DRIVEN.
But where do we start without creating even more numbers?
05. FINANCE, BI AND THE BUSINESS ALL HAVE DATA.
But do they tell the same story together?
06. WE WANT TO STEER DIFFERENTLY.
But what information do our people really need for that?
STEERING IS CONSTANTLY CORRECTING COURSE
You never fly exactly according to plan.
You just want to see early enough that you are drifting off course.

- F3A · Precision Aerobatics.
The Success Trap™
The Success Trap:
Your numbers look good. Until suddenly they don't.

Most management information looks back. Revenue, margin, profit, productivity and customer satisfaction tell you how the past period went.
And as long as those numbers are good, there seems to be little wrong.
But the causes of a disappointing result often arise much earlier. In a process that slowly deteriorates. A lead time that keeps increasing. Fewer new enquiries. A falling conversion rate. Capacity that comes under more and more pressure.
If you only see it in the result, you are often weeks or months too late.
Good management information shows what is changing before it hurts.
Business optionality™
Business Optionality:
See it sooner. Be able to choose sooner.

Good management information does not predict the future.
It gives you something more valuable: time to act.
When a team sees early that an important process is drifting off course, there are still choices. Correct course. Shift capacity. Change priorities. Call a customer. Adjust a process. Give more attention to something that is falling behind.
The later the signal, the smaller that room for manoeuvre becomes.
That is Business Optionality in numbers: not just knowing where you stand, but knowing early enough what is changing to still be able to choose.
Freedom is being able to choose. Good management information gives you that choice sooner.
RESULTS
→ tell you what has happened
SIGNALS
→ tell you what is changing
SEEING SOONER
→ gives you time to correct course
MORE CHOICES
→ gives you freedom to act
How I can help
From data to an organisation that steers by it.
A KPI Alchemist project does not start with a dashboard. We start with the question of how your organisation wants to steer differently. From there, we build the steering model together with the people who will have to steer with it.
01
Direction & Governance
What do you want to steer on differently?
We start with strategy, goals and the decisions management and teams want to be able to make better.
02
Processes
What needs to go well for that?
We map the most important processes and determine where performance is actually created.
03
Measurable numbers
What can we see along the way?
Together with the people who do the work, we look for signals in the process. Broadly at first; not every number becomes a KPI.
04
Impact & KPIs
Which numbers tell the right story?
With the Impact Matrix we select the figures with the greatest impact, predictive value and influenceability.
05
Data & Dashboarding
How do we make it visible?
We define KPIs, identify data sources and connect the business, Finance and BI so the right story becomes reliably visible.
06
Ownership & Rhythm
How do we make sure people actually steer with it?
Teams take responsibility for their own management information. We decide who steers on what, when KPIs are discussed and when action is needed.
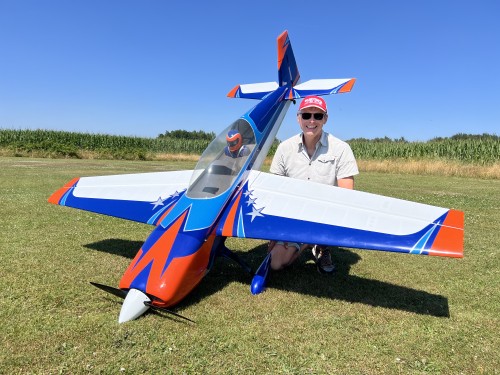
- IMAC/F3A-X · Precision Aerobatics
FROM MEASURING TO STEERING
The end product is not the dashboard.
The end product is an organisation that steers differently.
A dashboard can be built perfectly and still change almost nothing.
The real change happens when teams themselves understand which numbers matter, what story those numbers tell and when they need to correct course.
When KPIs are no longer something you report to your manager, but information you want to see yourself to do your work better.
When the conversation no longer starts with “Why was last month’s result disappointing?”, but with:
“What do we see happening now, and what are we going to do about it?”
Then data becomes part of the way an organisation thinks, decides and acts.
To me, that is working data-driven.
Not a better dashboard. An organisation that steers better.
Whoever sees sooner what is changing has more time to choose.
WHY I DO THIS
I thought that after my third exit I would finally never have to do anything again.
That turned out to be a mistake.
After selling my third company, I deliberately stepped back. No company for a while. No employees. No agenda.
I thought doing nothing would do me good.
After a year of burnout, my wife looked at me and said:
"I think it's time you found yourself a hobby again."
I rediscovered how much energy I get from entrepreneurs, management teams and organisations that want to change something. And in doing so, I came back to something that has run through my work throughout my career: using numbers to make better decisions.
As an entrepreneur, Finance Director and later as a KPI Black Belt, I have seen that organisations rarely have too little data. The difficulty is discovering which numbers matter, what story they tell and how you let people steer with them themselves.
That is why I enjoy KPI Alchemist projects so much.
Not to build dashboards. But to build, together with the people in the organisation, a way of steering that becomes theirs and keeps working after I have left.
PROVEN IN PRACTICE
More than 400 people have already gone looking for the numbers that tell the right story.
Together we examined one of our most important processes from start to finish. A process we carry out every day, but in which we had become blind to inefficiencies we had created ourselves.
CEO · MANUFACTURING scale-up
The workshop gave us a completely fresh view of our potential. Clearly and warmly guided by Jeroen.
PARTICIPANT · Management team
9+ average rating
from 400+ participants in 60+ KPI workshops.
KPI WORKSHOPS · ORGANISATIONS & MANAGEMENT TEAMS
READY TO STEER DIFFERENTLY?
You probably have enough data.
The question is whether you are seeing the right things.
A better dashboard is rarely the real issue. It is about which numbers help you see sooner what is changing, make better decisions and place responsibility where people can actually correct course.
Let’s start with your management information challenge.